Benjamin A. Olsho
A Cross-Sectional Analysis of the Hollywood Stock Exchange’s Forecasting Accuracy and Risk vs. Return Relationships
THE PENNSYLVANIA STATE UNIVERSITY SCHREYER HONORS COLLEGE
A CROSS-SECTIONAL ANALYSIS OF THE HOLLYWOOD STOCK EXCHANGE’S FORECASTING ACCURACY AND RISK VS. RETURN RELATIONSHIPS
BENJAMIN A OLSHO SPRING 2013
A thesis submitted in partial fulfillment of the requirements for a baccalaureate degree in Finance with honors in Finance
Reviewed and approved* by the following:
Timothy Simin Associate Professor of Finance Thesis Supervisor
James Miles Professor of Finance Honors Adviser
- Signatures are on file in the Schreyer Honors College.
i
ABSTRACT
This paper examines 98 MovieStocks traded on the online entertainment prediction market, the Hollywood Stock Exchange (HSX). The analysis primarily sheds light on the market’s long-term predictive accuracy and risk vs. return relationships. In both categories, variables including a movie’s genre, time to release, and total box office revenue are considered.
Data includes popular movies released from July 2011 to January 2013 from the 10 largest domestic film studios. The results will be of interest to Hollywood executives and movie exhibitors for decisions involving marketing and revenue forecasting. HSX participants will also benefit from analysis of the risk-adjusted returns of various MovieStocks.
TABLE OF CONTENTS
List of Figures .......................................................................................................................... iii
List of Tables ........................................................................................................................... iv
Acknowledgements .................................................................................................................. v
Introduction .............................................................................................................................. 1
Background .............................................................................................................................. 3
Prediction Markets ........................................................................................................... 3 The Hollywood Stock Exchange..................................................................................... 5 Industry Background........................................................................................................ 8
Research Focus ........................................................................................................................ 11
Data.................................................................................................................................... 12
Forecast Accuracy .................................................................................................................... 13
Methodology .................................................................................................................... 14 Results .............................................................................................................................. 17
Risk vs. Return......................................................................................................................... 24
Conceptual Framework .................................................................................................... 24 Methodology .................................................................................................................... 26 Results .............................................................................................................................. 27
Conclusion and Applications ................................................................................................... 32
Appendix.................................................................................................................................. 35
References................................................................................................................................ 47
iii
LIST OF FIGURES
Figure 1: HSX Predictive Accuracy ........................................................................................ 8
Figure 2: U.S./Canada Box Office Revenues 2002-2011 ........................................................ 10
Figure 3: 2011 Box Office Attendance .................................................................................... 10
Figure 4: HSX Expectation of Opening Weekend Revenue 1 Day Before Release................ 19
Figure 5: HSX Expectation Of Opening Weekend 80 Days Before Release .......................... 20
Figure 6: HSX MovieStock Risk vs. Return Relationship ...................................................... 28
Figure 7: U.S./Canada Box Office Admissions 2002-2011 (Source: MPAA) ........................ 36
Figure 8: HSX Expectation of Opening Weekend Revenue 1 Week Before Release ............. 41
Figure 9: HSX Expectation of Opening Weekend Revenue 2 Weeks Before Release ........... 41
Figure 10: HSX Expectation of Opening Weekend Revenue 3 Weeks Before Release ......... 42
Figure 11: HSX Expectation of Opening Weekend Revenue 50 Days Before Release .......... 42
Figure 12: Absolute Prediction Error vs. Total Box Office Gross .......................................... 43
Figure 13: Return/Std. Ratio vs. Total Box Office Gross........................................................ 46
iv
LIST OF TABLES
Table 1: Popular Prediction Markets ....................................................................................... 4
Table 2: 2012 Studio Market Share ......................................................................................... 12
Table 3: HSX Prediction Accuracy Across Time .................................................................... 18
Table 4: HSX Prediction Accuracy by Genre .......................................................................... 21
Table 5: HSX Prediction Accuracy by Total Box Office Gross .............................................. 23
Table 6: The 10 Best HSX Investments by Return/Standard Deviation Ratio ........................ 29
Table 7: The 10 Worst HSX Investments by Return/Standard Deviation Ratio ..................... 29
Table 8: MovieStock Risk and Return by Total Box Office Gross ......................................... 30
Table 9: MovieStock Risk and Return by Genre ..................................................................... 31
Table 10: The Big Six Studios and their Subdivisions ............................................................ 35
Table 11: Master List of 98 Movies Included in Study ........................................................... 38
Table 14: HSX MovieStock Return Summary Statistics ......................................................... 43
Table 15: HSX MovieStock Standard Deviation Summary Statistics ..................................... 44
Table 16: 86 Movies Sorted by Return/Std. Ratio ................................................................... 46
v
ACKNOWLEDGEMENTS
This thesis would not have been possible without the wisdom, skill, and resources of those who guided me throughout the research process. First and foremost, I would like to thank my thesis supervisor, Professor Simin, for lending his research expertise and quantitative skill to the analysis. I would also like to thank my Honors Advisor, Professor Miles, for his assistance in shaping the design of this thesis and consistently providing insightful new research avenues. Thanks to Professor Kleit for the original inspiration for this project and to Professor Haushalter for Excel expertise that saved countless hours of tedious repetition.
I am also grateful to the Hollywood Stock Exchange for providing the data necessary to complete this research and to Penn State’s Smeal College of Business, its Finance Department, and the College of Earth and Mineral Sciences for funding.
And finally, thank you to my family whose encouragement throughout my scholastic endeavors has constantly inspired me.
Introduction
Few modern industries match the glitz and glamour of Hollywood. Despite recent growth in home cinema sales and illegal downloading, the allure of the silver screen continues to generate big lines and big profits for movie theaters, actors, and production studios. The Motion Picture Association of America (MPAA) estimates $10.2 billion in 2011 admissions revenue for an industry that draws more people to theaters each year than all U.S. theme parks and sporting events combined (Theatrical Market Statistics, 2011). To satiate consumer’s demand for bigger explosions, better acting, and more realistic effects, movie studios compete with ballooning production and advertising budgets that often exceed $100 million. As such, accurately predicting a flop or forecasting the next box office smash is an important component of studios and theater companies’ decision-making processes. However, conventional forecasting methods have prediction errors as high as 60% (Foutz and Jank, 2007). Recently, the use of virtual prediction markets such as the Hollywood Stock Exchange has aided forecasting accuracy, but there still remains much to understand in terms of how genre, time to release, and box office gross affect these forecasts.
The Hollywood Stock Exchange is an online prediction market that allows users to trade shares of entertainment securities whose values are based on the success of movies and actors. Although legal restrictions prevent the use of real money, the HSX operates much like a traditional stock exchange with users buying and selling stocks, bonds, and futures using a virtual currency known as the Hollywood Dollar (H$). In
addition to its entertainment value, the HSX has proven to be an extremely beneficial tool for studios, theater companies, and academic researchers who use the exchange for market research and revenue forecasting. Prior studies (Berg and Rietz, 2003; Elberse and Anand, 2007; Servan-Schreiber, Wolfers, Pennock, and Galebach, 2004) have proven the HSX’s high degree of forecast accuracy, but focus mostly on predictions during the few days leading to a movie’s release. This paper adds to existing research by expanding the scope of analysis to time intervals up to 80 days before a film’s release. Broadening the time horizon allows for better understanding of projected revenues at various stages throughout a movie’s life cycle. Applications of this research are relevant to production studio and theater executives in charge of determining post-production marketing budgets and distribution channels. The paper further explores other factors that affect the quality of HSX predictions including a movie’s genre and total box office revenue.
In an extension of this analysis, the second half of this thesis examines the risk vs. return relationships of HSX MovieStocks. This section allows for comparison of HSX market dynamics to traditional security exchanges and provides practical trading strategies for HSX participants. A cross-sectional study further determines which HSX investments provide the best risk-adjusted return.
The paper begins with a general background of prediction markets, the HSX, and the Hollywood industry. I then present the data and methodology used to test my hypotheses before discussing results, applications, and areas for future research.
Background
Prediction Markets
Before fully explaining the Hollywood Stock Exchange (HSX), it is important to first describe prediction markets. In summary, prediction markets (a.k.a. decision markets, idea futures, virtual markets, and information markets) allow users to trade around unknown future events such as elections, sporting events, or even economic policies. The research value in using virtual markets as forecasting tools comes from the interpretation of market prices as predictions of the probability of certain events occurring. For example, imagine that a contract pays $1 if Senator X wins the upcoming election and $0 if he loses. If you think Senator X has a 40% chance of winning, you will pay no more than 40 cents for that contract. The supply and demand of contracts traded amongst thousands of participants thus form the market consensus price.
As a result of legislation outlawing online gambling in the United States, most prediction markets operate using play money. There are exceptions, however—notably the Iowa Electronics Market (IEM), which was granted amnesty from online gambling regulations so long as the exchange continues to operate for the purposes of academic research and the operators receive no financial compensation (“CFTC No-action Letter”). Despite the fact that many other prediction markets are forced to use play-money, Servan-Schreiber, Emile, Wolfers, Pennock, and Galebach (2004) find that these markets still operate with a degree of accuracy similar to real-money markets. Leaderboards and
prizes given to top earners are common ways to incentivize accurate predictions in play- money markets.
Many companies have also found benefits in using internal prediction markets to forecast sales. One such example is a market developed by Hewlett Packard that accurately forecasted printer sales better than their traditional processes (Plott and Chen, 2002). Some of today’s most popular prediction markets are shown in Table 1 below, prepared by Wolfers and Zitzewitz (2004):
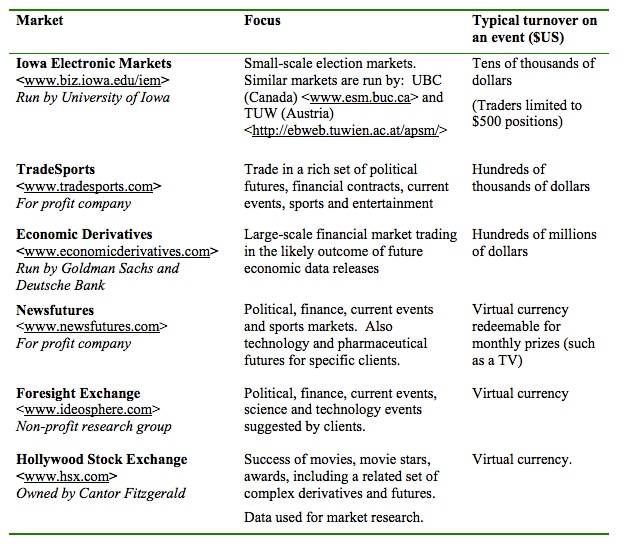
Caption: Table 1: Popular Prediction Markets Figure text: Market Focus Typical turnover on an event ($US) Iowa Electronic Markets <www.biz.iowa.edu/iem> Run by University of Iowa Small-scale election markets. Similar markets are run by: UBC (Canada) <www.esm.buc.ca> and TUW (Austria) http://ebweb.tuwien.ac.at/apsm/ Tens of thousands of dollars (Traders limited to $500 positions) TradeSports <www.tradesports.com> For profit company Trade in a rich set of political futures, financial contracts, current events, sports and entertainment Hundreds of thousands of dollars Economic Derivatives <www.economicderivatives.com> Run by Goldman Sachs and Deutsche Bank Large-scale financial market trading in the likely outcome of future economic data releases Hundreds of millions of dollars Newsfutures <www.newsfutures.com> For profit company Political, finance, current events and sports markets. Also technology and pharmaceutical futures for specific clients. Virtual currency redeemable for monthly prizes (such as a TV) Foresight Exchange <www.ideosphere.com> Non-profit research group Political, finance, current events, science and technology events suggested by clients. Virtual currency Hollywood Stock Exchange <www.hsx.com> Owned by Cantor Fitzgerald Success of movies, movie stars, awards, including a related set of complex derivatives and futures. Data used for market research. Virtual currency.
Information markets have become increasingly popular over the last decade as their ability to accurately forecast future events including election results and Oscar winners have been publicized (Berg and Rietz, 2003; Elberse and Anand, 2007; Servan-Schreiber, Wolfers, Pennock, and Galebach, 2004; Pennock, David M., Steve Lawrence, Finn A. Nielsen, and C. L. Giles, 2001). For example, the Iowa Electronics Markets (IEM), best known for its political markets, has proven more accurate than traditional polls in predicting election results since its creation in 1988 (Wolfers and Zitzewitz, 2004). Another prediction market known as the Hollywood Stock Exchange (the focus of this research), famously predicted 22 of 24 top-category Oscar winners from 2005 to 2007 (HSX Press Release, 2007).
Compared to products in other industries (such as manufacturing, retail, and automotive), movies have a relatively short one to five year life cycle. The ability to track movies from cradle-to-grave provides a concise window for analysis and is a chief reason for interest amongst researchers. Elberse and Anand’s 2007 study demonstrates another practical application of the HSX in its ability to chart the entire “dynamic path of a movie’s stock price.” In other words, the HSX allows researchers to analyze real-time forecasts of motion pictures spanning from the first signs of production until four weeks into the movie’s release. The next section will take a closer look at the HSX and how it fits into the research focus of this paper.
The Hollywood Stock Exchange
The Hollywood Stock Exchange is an online entertainment prediction market that allows users to wager on the success or failure of movies and actors in a simulated
supply-and-demand based market. The HSX acts very much like the NYSE or NASDAQ in terms of trading, but rather than using real money, the HSX is based around a virtual currency known as the Hollywood Dollar (H$) which traders use to buy, sell, or short shares of various entertainment securities. Each new user is given H$2,000,000 to purchase “MovieStocks”, “TVStocks,” “StarBonds,” etc. whose underlying values are based on market-determined predictions of the expected revenue from each category.
This study will largely focus on MovieStocks, however, whose share price reflects, “how much money traders think the film will make domestically in its first four weeks of wide release at the box office” (HSX.com). For example, if a MovieStock is trading at H$100 per share, the market predicts that that the movie will gross $100 million in its first four weeks of opening. Just like traditional stocks, the life of a MovieStock begins at its Initial Public Offering (IPO). The HSX decides when to release an IPO based on a movie’s “theatrical release date, production start date, distributor, star power of the actors, the director and/or producers involved, stage of script development, popularity of concept (book, comic, videogame) and whether there’s current news. The more factors that are known and certain, the more likely a project will get an IPO.” Occasionally, enough buzz is generated around an expected release that it begins trading many years before the movie even begins production. (A good example of this is the thus far unnamed James Bond 24).
In order to keep market estimates in line with actual box office figures, the HSX briefly halts trading of each MovieStock and “adjusts” its price to match actual grosses. Trading halts at 6PM PST on the Saturday of the film’s opening weekend and resumes the following Sunday, usually between 10AM and 1PM PST. In its price adjustments, the
HSX estimates that “a film makes 2.7 times its opening weekend box office during its first four weeks of wide release.” This is a standard multiplier applied to all traditional three-day opening weekend releases. For movies released mid-week or during holidays, multipliers vary slightly; however, this paper uses 2.7 as the standard discount factor in predicting opening weekend revenues from all HSX MovieStock prices.
After four weeks of wide release, a MovieStock cashes out at its market price and investors are credited money in proportion to the number of shares they own. Keep in mind that many films will continue to show in theaters even after their MovieStock delists. Nonetheless, Elberse (2007) finds that “four-week revenues on average make up about 85% of the total theatrical revenues of a movie and explain 96% of the variance in those revenues.” If a movie never reaches the 650 theater minimum necessary to be classified as a “wide-release,” the MovieStock is considered a “limited release” and the stock will cash out after an extended period of 12 weeks. To prevent manipulation, a trading limit of 100,000 shares per user is set for each MovieStock.
Although HSX participant demographics were not available for this study, “By the summer of 2006, [the] HSX has had 0.62 million active traders world wide, with the median age of 26. Among them 72% are males and 72.3% reside in U.S. and Canada” (Foutz and Jank, 2007).
Through its adaptive crowd sourcing, the HSX is capable of “predicting movie box office results and entertainment award outcomes—as accurate, or more accurate than expert opinions” (Pennock, Lawrence, Nielsen, Giles; 2001). Wolfers and Zitzewitz (2004) display just how accurate the HSX was at forecasting opening weekend revenues of 489 movies released between 2000 and 2003 in Figure 1 below:
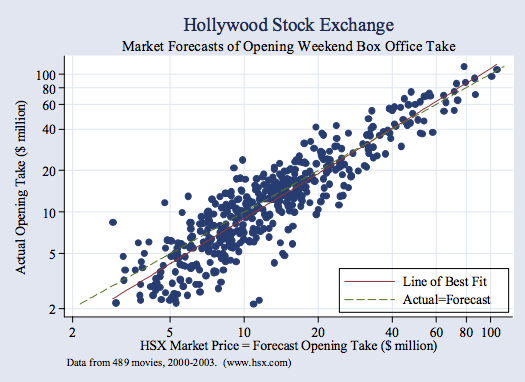
Caption: Figure 1: HSX Predictive Accuracy Figure text: Hollywood Stock Exchange Market Forecasts of Opening Weekend Box Office Take. Actual Opening Take ($ million). HSX Market Price = Forecast Opening Take ($ million). Data from 489 movies, 2000-2003. (www.hsx.com). Line of Best Fit. Actual=Forecast. 2, 5, 10, 20, 40, 60, 80, 100.
This thesis finds similar accuracy in HSX forecasts of opening weekends (see “Forecast Accuracy” section) and further dissects the data to determine the root causes of prediction errors for movies that stray from the regression.
Industry Background
According to Hoover’s Online, the U.S. motion picture production and distribution industry (SIC codes 7812 and 7822) consists of approximately 11,000 companies with combined annual revenue of $60 billion. The domestic market is highly concentrated with the largest major studios (Paramount, Warner Bros., Columbia, Walt Disney, Universal, and 20th Century Fox), commonly referred to as “The Big Six,” historically accounting for approximately 80% of all box office revenues (Box Office Mojo Studio Index). As a result of the prohibitive costs associated with producing and
marketing a film, large media conglomerates typically own the major motion picture studios. The Big Six studios above are subsidiaries of Viacom, Time Warner, Sony, Disney, NBC, and News Corporation, respectively. Please see Table 10 in the appendix for a full list of these conglomerates and their subdivisions.
In an industry in which major studios typically release only 15 to 25 movies a year, the success or failure of individual releases can greatly impact a studio’s bottom line. This is especially true of smaller studios, which lack the financial backing and vertical integration of larger conglomerates. Although the MPAA stopped releasing production and marketing costs in 2007, the last available estimate showed a cost of $106.6 million for the average movie (MPAA 2007 Theatrical Market Statistics Report). Of this, $70.8 million went into production costs and $35.9 million were related to marketing activities. The high failure rate in theatrical releases and the extraordinary cost of production and distribution requires studios and theater companies to spend millions of dollars on forecasting models and market research efforts each year.
A film’s opening weekend is an extremely important indicator of its future success, contributing about half of a film’s overall theatrical revenues (Foutz and Jank, 2007). As such, studios and theater companies closely follow release weekends to project future revenues from ticket sales, international sales, and DVD releases.
One problem the industry faces is the potential saturation of U.S. theater audiences. Domestic admissions per capita have declined considerably from 5.2 in 2002 to 3.9 in 2011 (see Figure 7 in the appendix) owing to the growth of streaming movie services such as Netflix, home theaters, and illegal downloading. This trend has greatly increased competition amongst studios and put greater pressure on other distribution
channels including cable television, the Internet, DVD sales, and international markets.
Although, U.S./Canada box office revenues have trended slightly upward ($9.1 billion in 2002 to $10.2 billion in 2011), much of this increase can be attributed to higher ticket prices, rather than more admissions.
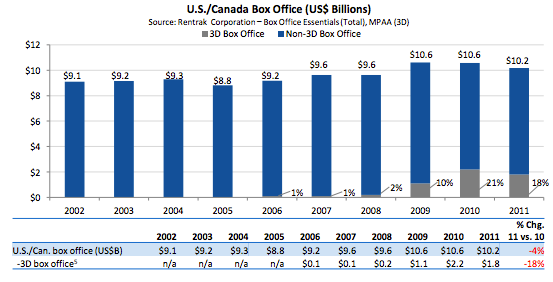
Caption: Figure 2: U.S./Canada Box Office Revenues 2002-2011 Figure text: U.S./Canada Box Office (US$ Billions) Source: Rentrak Corporation – Box Office Essentials (Total), MPAA (3D) 3D Box Office Non-3D Box Office $12 $10 $9.1 $9.2 $9.3 $8.8 $9.2 $9.6 $9.6 $10.6 $10.6 $10.2 $8 $6 $4 $2 1% 1% 2% 10% 21% 18% $0 2002 2003 2004 2005 2006 2007 2008 2009 2010 2011 % Chg. 2002 2003 2004 2005 2006 2007 2008 2009 2010 2011 11 vs. 10 U.S./Can. box office (US$B) $9.1 $9.2 $9.3 $8.8 $9.2 $9.6 $9.6 $10.6 $10.6 $10.2 -4% -3D box office^5 n/a n/a n/a n/a $0.1 $0.1 $0.2 $1.1 $2.2 $1.8 -18%
Despite declining per capita ticket sales, with U.S./Canada admissions totaling 1.285 billion in 2011, movie theaters draw more people per year than all theme parks and U.S. sports combined:
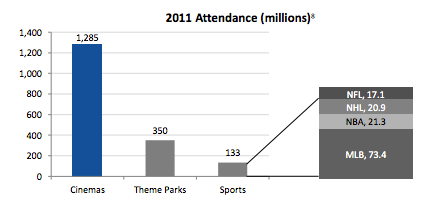
Caption: Figure 3: 2011 Box Office Attendance Figure text: 2011 Attendance (millions)^8 1,400 1,285 1,200 1,000 800 600 350 400 200 133 0 Cinemas Theme Parks Sports NFL, 17.1 NHL, 20.9 NBA, 21.3 MLB, 73.4
Research Focus
This thesis expands the scope of existing studies of the HSX in a cross-sectional analysis of the market’s forecast accuracy and risk vs. return relationships. The goal of this research is to analyze HSX trading data from new angles, in an easy-to-follow methodology that will provide practical trading applications for HSX participants and foster future research. I also discuss implications for managers in the motion picture industry who rely on virtual markets for forecasting demand. The paper is divided into two distinct sections that seek to answer the following questions:
Forecast Accuracy: How good is the HSX at predicting opening weekend box-office revenues? When are these predictions most/least accurate? Is the HSX better at predicting movies from certain genres? Does total film revenue affect the HSX’s predictive abilities?
Risk vs. Return: Does the risk/return relationship found in real-money markets hold with HSX MovieStocks? Which type of MovieStock provides the best risk-adjusted return? Can HSX traders use this relationship to build better portfolios?
Data
Data for this paper was purchased directly from the HSX1 and includes historical daily closing prices for up to 10 MovieStocks (with release dates from July 2011 to January 2013) that have the highest "market capitalization" from each of the 10 studios with the highest total box office gross during that time period. This data set includes a total of 98 MovieStocks since Relativity Studios only released 8 movies within the timeframe. HSX market capitalization is defined as “the total number of Hollywood Dollars that traders have invested in a particular MovieStock.” Trading data for each movie was available from the MovieStock’s IPO until its delist date four weeks after the movie’s release in theaters. A full list of the studios included in the sample is shown in Table 2 below by 2012 market share (Source: Box Office Mojo, 2012 Studio Index):
[Figure: Table showing 2012 Studio Market Share by rank, distributor, market share, and total gross]
Caption: Table 2: 2012 Studio Market Share Figure text: 2012 Studio Market Share Rank Distributor Market Share Total Gross ($mm) 1 Sony / Columbia 16.60% $1,792.20 2 Warner Bros. 15.40% $1,665.40 3 Buena Vista (Disney) 14.30% $1,551.40 4 Universal 12.20% $1,323.90 5 20th Century Fox 9.50% $1,025.40 6 Paramount 8.50% $914.40 7 Lionsgate 7.30% $791.70 8 Summit Entertainment 4.30% $463.60 9 Weinstein Company 2.40% $258.20 10 Relativity 1.90% $202.40
It should be noted that this data includes only a small percentage of the total theatrical releases over the past 18 months, but by choosing the MovieStocks with the highest market cap, we are able to analyze the films with the biggest economic impact. The Avengers ($623 million box office gross), The Dark Knight Rises ($448 million), and The Hunger Games ($407 million) are just a few of the popular releases included in this study. All box office gross figures in this paper are as of January 13, 2013. As a result, total gross figures may be higher for the several movies that were still in theaters at the time of writing this paper. A full list of the movies included can be found in Table 11 in the Appendix.
Industry data including studio market share, ticket sales, and industry revenue were found from the Motion Picture Association of America’s 2011 Theatrical Market Statistics Report and the online movie database website Box Office Mojo.
Forecast Accuracy
This section seeks to explore the accuracy and precision of HSX box office predictions. Moving forward, accuracy can be defined as how close a measured value is to its true value. Typically, accuracy is calculated in absolute terms (e.g. -5 points and 5 points are both 5 points away from 0). Precision, on the other hand, describes how close measured values are to each other. In other words, precision measures how biased certain predictions are. In terms of this analysis, I test how well the HSX forecasts opening weekend revenues at various time intervals throughout the life of MovieStocks and
further dissect these observations to determine the root cause of prediction errors. For example, is the HSX better at predicting action movies than romance movies? Does total box office gross play a role in the HSX’s predictive abilities? Obtaining a clear picture of the HSX’s forecast accuracy is essential to providing validity to future research.
Methodology
As described earlier, a MovieStock halts trading on the Saturday of the film’s opening weekend. Therefore, Saturday’s closing price represents the market’s last estimate of a movie’s four-week box office gross. To remove forecast bias in the form of early release statistics and visual clues into a movie’s opening weekend success (such as theater lines), I use the closing price on the day before a movie’s release to analyze the HSX’s forecast accuracy. Recall that the HSX adjusts MovieStock prices on the first Sunday after a movie’s release to match actual box office gross figures. The HSX’s implied prediction of opening weekend revenue is thus calculated by dividing the closing price on the day before a movie’s release by 2.7 (the HSX’s standard multiplier for adjusting prices of Friday releases).
To clarify, we look at the example of the James Bond hit Skyfall, which was released on Friday, November 9, 2012. On the day before Skyfall’s wide-release (Thursday, November 8), its MovieStock closed at H$197.13. The HSX’s implied opening weekend prediction was therefore $73.01 million ($197.13 million divided by 2.7). In fact, Skyfall exceeded HSX predictions and grossed approximately $88.6 million
during its opening weekend, equivalent to a $15 million difference. To account for this disparity, the HSX adjusted Skyfall’s price to H$239.26 ($88.6*2.7) on Sunday.
Of the 98 movies provided, 81 films had Friday release dates and 17 had mid-week release dates. Although the adjustment multiplier varies slightly for mid-week and holiday releases, the HSX applies the same Saturday halt and Sunday adjustment procedures regardless of release day.
In measuring HSX prediction error I use a statistic called mean absolute deviation (MAD).
MAD = 1/n Σ (Actual Opening Weekend Gross – HSX Expectation) (1)
In Equation 1, “n” represents the total number of observations. Actual opening weekend gross is calculated as a MovieStock’s closing price on its adjust date divided by 2.7. As described above, the HSX expectation is the MovieStock’s closing price the day before release divided by 2.7. For a particular movie, a small MAD indicates an accurate forecast and a large MAD indicates a poor forecast. MAD is a good measure of accuracy, but its absolute nature precludes analysis of over-estimation or under-estimation bias.
It should be noted that actual gross figures for mid-week releases might slightly vary from movie database websites such as IMDB and Box Office Mojo, which generally define opening weekends as Friday to Sunday only. The HSX, on the other hand, incorporates extended revenues for mid-week releases.
To evaluate prediction bias, I use a measure called Mean Forecast Error (MFE), which takes a simple average of actual opening weekend gross revenues minus the corresponding HSX expectation:
MFE = $\frac{1}{n} \sum_{t=1}^{n} (Actual\ Opening\ Weekend\ Gross - HSX\ Expectation)$ (2)
Using this formula, unbiased predictions will yield a MFE of 0. Over-estimation bias translates to a negative MFE and under-estimation bias translates to a positive MFE. It is important to note that MFE does not measure forecast accuracy because positive and negative errors cancel each other out.
One final metric used to measure forecast error is Mean Absolute Percentage Error (MAPE), which calculates absolute error as a percentage of opening weekend revenues:
MAPE = $\frac{100}{n} \sum_{t=1}^{n} \left| \frac{Actual\ Opening - HSX\ Expectation}{Actual\ Opening} \right|$ (3)
High MAPEs indicate large percentage errors and low MAPEs indicate small errors. MAPE is a useful measure for comparing forecast accuracy across different categories such as film genre and time from release.
Defining a movie’s genre is an extremely subjective task and often involves using multiple descriptors. For example, both 21 Jump Street and The Dark Knight Rises are action movies, but the former is an action-crime-comedy and the later is an action-crime-thriller. Anyone who has seen these two movies can attest to the differences in their plot lines. Despite the inherent challenges involved with sorting by genre, I use the Internet
Movie Database’s genre classifications to simplify the process. For any movie, IMDB lists between one and three different genres. The Denzel Washington movie Flight, for example, is defined only as a drama, whereas Wreck-it Ralph is classified as an animation-adventure-comedy. In aggregating movies for each genre, I include all movies that mention that specific genre in any part of its three-part classification. Returning to our previous example, both 21 Jump Street and The Dark Knight Rises are included in the action genre despite their aforementioned differences. This process admittedly allows for double (and sometimes triple) counting of movies, and may be a source of error in this analysis. Improved sorting of movie classifications provides a potential area for future research.
In total, IMDB listed 18 unique genres for the movies studied. To prevent statistical error, analysis was limited to the 10 genres that included more than 10 movies each: animation, adventure, sci-fi, action, comedy, crime, fantasy, drama, romance, and thriller.
Results
Accuracy Across Time
As expected, the HSX’s ability to accurately forecast opening weekend revenues is best one day before a movie’s release and declines as time until release increases. The chart below summarizes these findings:
[Figure: Table showing HSX prediction accuracy across time horizons]
Caption: Table 3: HSX Prediction Accuracy Across Time Figure text:
Time Before Release Correlation btwn. Actual Opening Weekend Gross & HSX Forecasts Mean Absolute Deviation (Accuracy) $mm Mean Forecast Error (Bias) $mm Mean Absolute Percent Error 1 Day 0.96 $6.67 $2.36 23% 1 Week 0.94 $8.93 $2.58 30% 2 Weeks 0.92 $9.92 $2.35 32% 3 Weeks 0.90 $10.97 $2.42 36% 50 Days 0.86 $11.99 $2.40 40% 80 Days 0.85 $12.69 $2.37 44%
As displayed above, the HSX demonstrates extremely accurate predictions of opening weekend grosses the day before a movie’s release with a Mean Absolute Deviation of $6.67 million and a Pearson correlation coefficient between actual and expected revenues of .96 across the 98 movies tested. This estimate of correlation is in line with previous research conducted by Elberse (2007), which found a Pearson coefficient of .94 between HSX halt and adjust prices. Predictions one day before a movie’s release also yield a Mean Absolute Percent Error of 23% from true values. With an average opening weekend of $35.51 million, 23% error is certainly significant, but still impressive considering the substantial uncertainty surrounding motion picture releases. However, these predictions grew increasingly less accurate as the time horizon from the movie’s release increased. At 80 days out, MAPE increases to 44%.
In terms of bias, the results display a Mean Forecast Error ranging from $2.36 million to $2.58 million across the time horizons tested, indicating a slight underestimation of actual opening weekend revenues. However, this bias follows no discernible pattern across time.
To further illustrate the HSX’s prediction errors across time, we juxtapose linear regressions of HSX expectations of opening weekend revenues 1 day before a movie’s release (Figure 4) and HSX expectations 80 days prior to the release date (Figure 5):
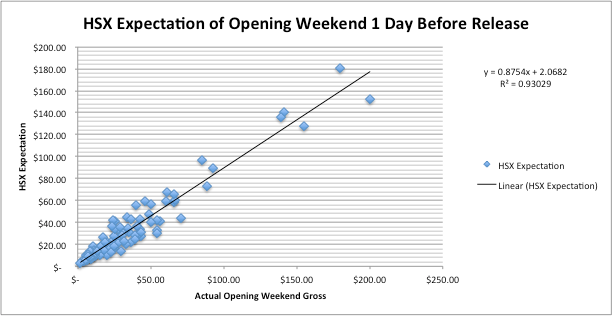
Caption: Figure 4: HSX Expectation of Opening Weekend Revenue 1 Day Before Release Figure text: HSX Expectation of Opening Weekend 1 Day Before Release. $200.00. $180.00. $160.00. $140.00. $120.00. $100.00. $80.00. $60.00. $40.00. $20.00. $-. $-. $50.00. $100.00. $150.00. $200.00. $250.00. Actual Opening Weekend Gross. HSX Expectation. y = 0.8754x + 2.0682. R² = 0.93029. HSX Expectation. Linear (HSX Expectation).
A cursory visual inspection of the graph shows an extremely tight-fitting regression with data points in close proximity to the line of best fit. This analysis is confirmed by a coefficient of determination (R²) of .93. In statistics, R² can be interpreted as how well a regression line fits a data set. An R² of 1 indicates a perfect fit, while 0 indicates no fit at all. Mathematically, R² is the square of the sample correlation coefficient between the outcomes and their predicted values. A t-statistic of 35.79 indicates a confidence level of 99.99%. The full regression statistics can be found in
Table 12 of the Appendix. Compare the graph of HSX expectations 1 day before a movie’s release to the graph of predictions 80 days out in Figure 5 below:
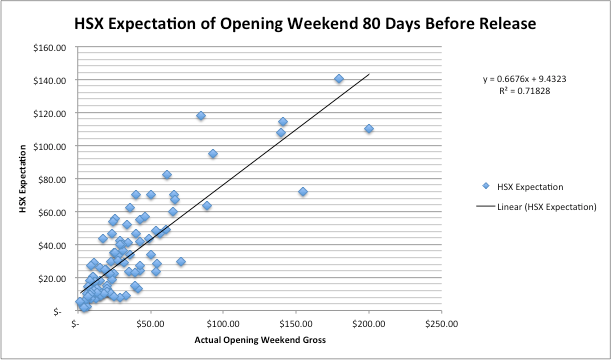
Caption: Figure 5: HSX Expectation Of Opening Weekend 80 Days Before Release Figure text: HSX Expectation of Opening Weekend 80 Days Before Release $160.00 $140.00 $120.00 $100.00 $80.00 $60.00 $40.00 $20.00 $- $- $50.00 $100.00 $150.00 $200.00 $250.00 Actual Opening Weekend Gross y = 0.6676x + 9.4323 R² = 0.71828 HSX Expectation Linear (HSX Expectation) HSX Expectation
Although the regression still maintains a relatively high R² of .71, notice how the data points stray slightly off the regression line. This indicates a higher degree of prediction error as compared to 1 day before a movie’s release. As before, a t-statistic of 15.64 indicates a confidence level of 99.99%. The full regression statistics can be found in Table 13 of the Appendix.
Intuitively, it makes sense that prediction accuracy would increase as the date to a movie’s release approaches as a result of better information being incorporated into HSX market prices. For example, at 80 days out, market participants may be unsure of the number of theaters the movie will be displayed in, whereas they have a much better idea
1 day before the release. Regression statistics and graphs for 1 week, 2 weeks, 3 weeks, and 50 days before a movie’s release can be found in the appendix.
Accuracy Across Genre
To further dissect sources of prediction error, I also evaluate accuracy across different movie genres. Despite potential error from double counting, the HSX demonstrates conclusive differences in its ability to predict opening weekend revenues of movies from different genres. Table 4 below summarizes the results with movie genres sorted in order of their Mean Absolute Percent Error:
[Figure: Table 4 showing HSX Prediction Accuracy by Genre]
Caption: Table 4: HSX Prediction Accuracy by Genre Figure text: Genre | Average Opening Weekend ($mm) | Correlation btwn. Actual Opening Weekend Gross & HSX Forecasts | Mean Absolute Deviation (Accuracy) $mm | Mean Forecast Error (Bias) $mm | Mean Absolute Percent Error | # Of Films Animation | $40.07 | 0.67 | $11.39 | $1.41 | 33.7% | 13 Romance | $19.42 | 0.93 | $4.59 | $2.07 | 23.5% | 11 Crime | $37.43 | 0.98 | $5.77 | $0.26 | 23.4% | 17 Comedy | $30.07 | 0.87 | $6.42 | $1.70 | 22.5% | 31 Drama | $27.75 | 0.98 | $4.78 | $2.18 | 22.3% | 40 Adventure | $52.18 | 0.96 | $8.35 | $0.88 | 22.3% | 30 Sci-fi | $46.38 | 0.98 | $8.03 | $1.87 | 22.3% | 11 Action | $45.68 | 0.98 | $7.54 | $3.28 | 20.4% | 36 Thriller | $27.38 | 0.99 | $3.61 | $0.20 | 20.0% | 21 Fantasy | $61.02 | 0.98 | $5.60 | $2.76 | 11.7% | 11
According to the results, the HSX is almost 3 times better at predicting fantasy movies than animation movies in terms of Mean Absolute Percent Error and approximately 2 times better on the basis of Mean Absolute Deviation. Interestingly, fantasy movies also had the highest average opening weekend of the 10 genres tested. With the exception of
fantasy and animation, the other genres studied displayed a MAPE ranging from 20 to 23.5%.
Making sense of the disparity between animation and fantasy movies is a challenging task. I begin by evaluating the movies in each genre that had the most/least accurate predictions. On a percentage error basis, animation predictions significantly missed the mark on Rise of the Guardians (74% error), The Adventures of Tintin (55%), Alvin and the Chipmunks: Chipwrecked (55%), and Lion King 3D (51%), but were dead-on in predicting Madagascar 3: Europe’s Most Wanted (2%) and Wreck-it Ralph (2%).
A closer look at the fantasy genre reveals accurate estimates of The Twilight Saga: Breaking Dawn Part 2 (1% error), The Odd Life of Timothy Green (1%), and Wrath of the Titans (2%), but less accurate predictions of Ted (44%) and The Immortals (29%). One possible explanation for these differences is that HSX participants may be more knowledgeable in predicting the movies in which they are most interested. According to Elberse and Anand (2005) “The [HSX’s] trading population is fairly heterogeneous, but the most active traders tend to be heavy consumers and early adopters of entertainment products, especially films.” Animation movies typically cater to younger audiences, while fantasy films are generally made for teenagers and older. With a median participant age of 26, the HSX may be best at predicting revenues of movies catered to this age group. Prediction accuracy based on HSX participant demographics could be an interesting source of future research.
Accuracy by Total Movie Gross
To complete the picture of sources of HSX prediction error, I divide the 98 movies in the sample into quintiles based on each movie’s total gross revenue. Quintile 1 thus contains the 20 highest grossing movies and Quintile 2 contains the next 20, etc. (note that Quintile 5 contains only 18 total movies). Table 5 below summarizes the results of this test:
[Figure: Table 5 showing HSX Prediction Accuracy by Total Box Office Gross]
Caption: Table 5: HSX Prediction Accuracy by Total Box Office Gross Figure text: Quintile | Average Total Gross | Correlation btwn. Actual Opening Weekend Gross & HSX Forecasts | Mean Absolute Deviation (Accuracy) $mm | Mean Forecast Error (Bias) $mm | Mean Absolute Percent Error 1 | $260,050,392.55 | 0.948 | $12.09 | $7.16 | 15.86% 2 | $123,134,547.30 | 0.340 | $10.37 | $3.13 | 29.81% 3 | $81,104,521.50 | 0.603 | $4.80 | $1.91 | 19.33% 4 | $49,102,609.20 | 0.942 | $3.05 | $0.20 | 18.43% 5 | $20,085,720.22 | 0.645 | $2.66 | $(0.94) | 31.40%
On the basis of mean absolute deviation, the HSX predictions are best for low-grossing movies in the 5th quintile (MAD of $2.66 million) and worst for high-grossing movies in the 1st quintile ($12.09). (Please refer to Figure 12 in the appendix for a graphical representation of absolute prediction error vs. box office gross). However, evaluating accuracy on a relative basis paints a completely different picture. In fact, the high-grossing movies in Quintile 1 had a MAPE of 15.86%, and the low-grossing movies in Quintile 5 had a MAPE of 31.40%. Intuitively, it makes sense that high-grossing movies would have a higher mean absolute deviation simply because of the scale of their opening weekends. For example, although the HSX underestimated The Hunger Games’ opening
weekend by approximately $26 million, this discrepancy translates to only a 17% prediction error on a $155 million opening weekend. Compare this to the $2.41 million absolute prediction error for the Katherine Heigl film One for the Money. With an opening weekend of only $11.75 million, this small underestimation translates to a 21% error.
Similar to MAD, mean forecast error (a measure of bias) also has a positive relationship to total box-office gross. On average, the HSX underestimates high-grossing movies, and slightly overestimates low-grossing movies. Predictions of movies in quintile 4 were the least biased, with a MFE of only $0.20 million.
Risk vs. Return
This section evaluates the HSX on the metrics of risk and return. Basic understanding of investments teaches that some assets are riskier than others (think: Treasury Bills vs. Small Cap Stocks). To be compensated for holding risky assets, investors demand a higher return relative to safe assets. In this section, I test to see whether this relationship holds in HSX MovieStocks and investigate what film characteristics may cause variation in risk or return.
Conceptual Framework
The cornerstone of modern portfolio theory is the Capital Asset Pricing Model (CAPM) developed in the 1960s by economists William Sharpe and Jack Treynor. The
CAPM states that the expected return on an asset equals the risk-free rate of a security plus its expected risk premium.
$$E(r_a) = r_f + \beta_a * E(r_m - r_f)$$ (4)
Where: $r_f$=risk free rate; $\beta$=beta of the security; and $r_m$=expected market return
The CAPM formula lays the foundation for the risk and return relationship discussed in this section. As described in Brealy, Myers, and Allen’s Principles of Corporate Finance, there are two types of risk: specific risk and market risk. Specific risk is “the risk that can potentially be eliminated by diversification” and market risk “stems from the fact that there are economy-wide perils that threaten all businesses” (179). Market risk is commonly represented as beta in the CAPM formula above and measures securities’ sensitivity to market-wide phenomena based on co-movement to a market index such as the S&P 500.
Since most securities do not move exactly together, beta can be used to help form diversified portfolios to help reduce an investors overall risk exposure. An essential focus of this thesis is thus shedding light on the nature of risk and return in the HSX as a means for participants to make better investment decisions in terms of portfolio diversification. Because overall market movement is difficult to measure in the HSX, this thesis looks at the risk/return profiles of specific MovieStocks only, and avoids conclusions based on market trends.
Methodology
This section provides specifics on the calculations involved in evaluating risk and return, but I first define some overall limitations to the data. To avoid sampling error, I initially limit my analysis of risk and return to the 86 MovieStocks with more than one year of trading data. Unlike traditional security exchanges that close on weekends and national holidays, the HSX trades during every day of the year. In order to limit noise, I use monthly MovieStock returns and standard deviations.
In calculating HSX MovieStock returns, I follow the formula for simple arithmetic return:
% Return = $\frac{(P_1 - P_0)}{P_0}$ (5) Where: P₁=Final Price; P₀=Initial Price
Because trading data for each movie occurs during different times, I average the monthly returns for the sake of comparison.
Specific risk is traditionally measured in terms of variance and standard deviation. The variance of a sample is defined as the average of the squared deviations from the mean:
Variance = $\frac{\sum(x_1 - \overline{x}_1)^2}{n_1 - 1}$ (6) Where: $\overline{x}_1$=mean of sample; n₁=number of observations
The standard deviation is simply the square root of variance and measures the spread of a set of numbers.
Traditionally, the Sharpe ratio is used in security analysis as measure of risk-adjusted performance.
Sharpe Ratio = $\frac{\bar{r}_p - r_f}{\sigma_p}$ (7)
Where: $r_p$ = portfolio return; $r_f$ = risk-free rate; $\sigma_p$ = portfolio standard deviation
Because there is no obvious risk-free rate in the HSX, we modify the formula as a simple ratio of a movie’s historical return to its historical standard deviation over the same timeframe (Return/standard deviation). The higher this ratio, the better the investment.
Results
Summary
Just like investing in the NYSE, the HSX offers a wide range of securities with different risk and return profiles. The 86 movies studied had an average monthly return of 5.09% and an average monthly standard deviation of 30.88%. To explore how closely risk and return are related in HSX MovieStocks, I ran a regression of average monthly returns vs. average monthly standard deviations shown in Figure 6 below:
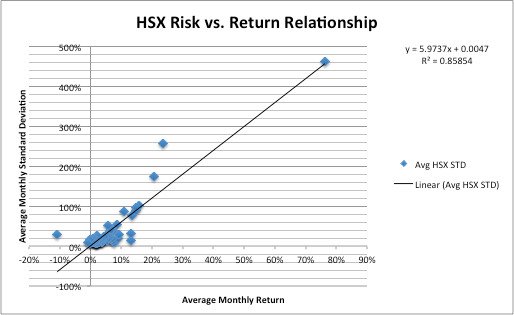
Caption: Figure 6: HSX MovieStock Risk vs. Return Relationship Figure text: HSX Risk vs. Return Relationship. y = 5.9737x + 0.0047 R² = 0.85854. Avg HSX STD. Linear (Avg HSX STD). Average Monthly Standard Deviation. Average Monthly Return. 500%, 400%, 300%, 200%, 100%, 0%, -100%. -20%, -10%, 0%, 10%, 20%, 30%, 40%, 50%, 60%, 70%, 80%, 90%.
An R² of .858 indicates that return explains approximately 86% of the variation in MovieStock standard deviation. As expected, this regression shows that riskier MovieStocks provide higher returns than less risky MovieStocks. The data point in the top right quadrant represents Beauty and the Beast 3D, which shot from H$1.40 to H$31.28 from 9/30/11 to 10/30/11 after Disney officially announced the movie’s release on 10/4/11. Attempts to remove/reduce potential outliers from the data using 90% Winsorization and Interquartile Range methodologies proved unfruitful because of the large number of outliers (9) from such a small sample set. These potential outliers were left in the data and accepted as representative of the high variation in risk and return from movie to movie. Even without Beauty and the Beast included, an R² of .62 still indicates a relatively strong relationship between risk and return.
In terms of individual movies, return to standard deviation ratios ranged from .957 (The Hunger Games) to -.393 (Machine Gun Preacher) and had an average of .196.
Table 6 below shows the 10 best HSX investments of the 86 movies tested by their return to standard deviation ratios:
[Figure: Table 6 showing the 10 best HSX investments by return to standard deviation ratio]
Caption: Table 6: The 10 Best HSX Investments by Return/Standard Deviation Ratio Figure text: The 10 Best HSX Investments by Return to Standard Deviation Ratio | Movie | Gross | Avg. HSX Monthly Return | Avg. HSX Monthly St. Dev. | Return/Std Ratio | The Hunger Games | $407,999,255.00 | 13.28% | 13.87% | 0.957 | Argo | $111,660,243.00 | 7.69% | 8.65% | 0.889 | Snow White & The Huntsman | $155,111,815.00 | 7.45% | 12.68% | 0.588 | Safe House | $126,149,655.00 | 8.97% | 19.40% | 0.462 | Dr. Seuss' the Lorax | $213,949,505.00 | 3.61% | 8.32% | 0.434 | Sinister | $48,056,940.00 | 6.81% | 15.69% | 0.434 | Rise of the Planet of the Apes | $176,740,650.00 | 13.23% | 31.10% | 0.425 | Men In Black 3 | $179,020,854.00 | 5.50% | 14.00% | 0.393 | Contraband | $66,489,425.00 | 6.85% | 18.06% | 0.379 | Brave | $237,282,182.00 | 2.07% | 5.84% | 0.354
Unfortunately, not all investments turned out so well. Table 7 shows the 10 worst investments of the sample set:
[Figure: Table 7 showing the 10 worst HSX investments by return to standard deviation ratio]
Caption: Table 7: The 10 Worst HSX Investments by Return/Standard Deviation Ratio Figure text: The 10 Worst HSX Investments by Return to Standard Deviation Ratio | Movie | Gross | Avg. HSX Monthly Return | Avg. HSX Monthly St. Dev. | Return/Std. Ratio | The Darkest Hour | $21,426,805.00 | 0.97% | 19.76% | 0.049 | Abduction | $28,064,226.00 | 0.46% | 13.31% | 0.035 | The Raven | $16,005,978.00 | 0.40% | 12.10% | 0.033 | Texas Chainsaw 3D | $30,880,985.00 | 0.35% | 10.84% | 0.032 | Ice Age: Continental Drift | $161,239,971.00 | 0.24% | 7.64% | 0.031 | The Master | $16,008,867.00 | 0.15% | 14.34% | 0.010 | War Horse | $79,883,359.00 | -0.05% | 6.89% | -0.007 | The Perks of Being a Wallflower | $17,581,481.00 | -0.21% | 15.18% | -0.014 | Alvin and the Chipmunks: Chipwrecked | $133,103,929.00 | -0.90% | 9.57% | -0.094 | Machine Gun Preacher | $537,580.00 | -10.85% | 27.61% | -0.393
Risk and Return by Total Box Office Gross
Comparing the best and worst HSX investments by return/standard deviation ratios hints at a positive correlation between total box office gross and risk-adjusted returns. To test implications for HSX traders, I regressed return/standard deviation ratios vs. total box office gross revenues to see if any connection could be found. The regression indicates only a small connection between risk-adjusted return and total box office gross, yielding an R² of .15. A t-statistic of 3.79 indicates a confidence level of 99.9%. Although minor, these results suggest that HSX traders should weight their portfolios more heavily with high grossing movies than low grossing movies. In practice, this strategy may be challenging, however, since total box office gross is not known during each MovieStock’s active trading window. Nonetheless, results from the accuracy section of this paper indicate that the HSX does a pretty good job of ball-parking revenue even 80 days before a movie’s release.
Table 8 below further divides each of the 86 movies into quintiles based on their total gross revenue:
[Figure: Table showing MovieStock risk and return by total box office gross quintiles]
Caption: Table 8: MovieStock Risk and Return by Total Box Office Gross Figure text: Quintile | Average Gross | Avg. Monthly Return | Avg. Monthly St. Dev. | Return/Std. Ratio | # Of Movies 1 | $276,942,308.76 | 4.34% | 14.55% | 0.30 | 17 2 | $137,745,864.29 | 5.44% | 32.39% | 0.25 | 17 3 | $86,321,217.76 | 4.66% | 30.24% | 0.19 | 17 4 | $56,445,484.47 | 9.41% | 53.75% | 0.21 | 17 5 | $21,755,568.28 | 1.80% | 23.86% | 0.05 | 18
In agreement with the regression, the chart also shows that, on average, the highest grossing movies provide the best risk-adjusted return. Part of this may be explained by
the HSX’s IPO procedure, which purposely leaves room for price growth to encourage participation from traders. As a result, high-grossing movies have a much larger opportunity to increase their share price than low-grossing movies. Even though MovieStock returns do not necessarily correlate to studios’ return on investment for each movie, HSX investors should take note of the opportunity to buy into historically high-grossing action and adventure movies at their IPOs. Quintile 4 is heavily skewed as a result of the inclusion of Beauty & The Beast 3D (discussed in the previous section).
Risk and Return by Genre
In this section, I sort each of the 86 movies by genre to see if certain types of movies perform better on the HSX than others. Table 9 below shows this relationship:
[Figure: Table 9 showing MovieStock Risk and Return by Genre]
Caption: Table 9: MovieStock Risk and Return by Genre Figure text:
Genre Average Gross Avg. Monthly Return Avg. Monthly St. Dev. Return/Std. Ratio Count Action $139,408,386.17 4.58% 27% 0.21 35 Adventure $161,638,164.61 4.42% 25% 0.22 28 Crime $111,362,099.31 2.30% 18% 0.15 16 Animation $150,311,226.92 9.22% 57% 0.17 12 Comedy $107,051,698.00 3.02% 16% 0.18 25 Drama $86,459,478.39 4.82% 29% 0.22 33 Fantasy $159,064,035.09 10.87% 64% 0.19 11 Thriller $88,961,612.12 4.68% 28% 0.22 17
On a risk-adjusted basis, different genres have relatively similar performance—of the 8 categories included, return/standard deviation ratios ranged from .15 (crime) to .22 (adventure and thriller). Fantasy movies had both the highest average monthly return and the highest average monthly standard deviation, while crime movies had the lowest average risk and return.
Despite fantasy movies’ high average monthly standard deviation, they were also part of the genre with the lowest MAPE in forecasting accuracy, indicating that HSX traders are able to keep up with the uncertainty surrounding fantasy movie releases.
Conclusion and Applications
Given the prohibitive costs of movie production, advertising, and distribution, the ability to accurately forecast film revenue is an important component of studios and theater companies’ decision-making processes. Previous literature has shown how the industry can utilize virtual prediction markets such as the Hollywood Stock Exchange to provide reliable pre-release demand forecasting. This paper adds to existing research by expanding analysis of the HSX to its long-term predictive reliability and its internal risk vs. return relationships.
Specifically, I find that the HSX’s predictions are most accurate the closer the date to a film’s release. One day before a movie’s release, HSX forecasts had a mean absolute prediction error of 23%, compared to 44% 80 days out. Nonetheless, Foutz and Jank (2007) find that more extensive examination of a Moviestock’s entire trading history using functional shape analysis can further reduce pre-release prediction error to as low as 8.31%. These results suggest that HSX forecasts (while still more accurate than traditional methods) should be used in conjunction with other forms of analysis for the best results. Undoubtedly, the longer managers in the motion picture industry wait, the better forecasts they will receive. The ability to derive early forecasts, however, is extremely valuable due to the high costs of post-production marketing activities. For this
purpose, HSX forecasts paint a pretty good picture of a film’s success even more than two months from release.
In practice, the endogeneity of motion picture advertising makes it hard to gauge the feasibility of using pre-release forecasts for marketing decisions. In other words, marketing has a direct effect on a motion picture’s success—putting some control of ultimate box office performance in the hands of studio executives. As such, managers should use HSX forecasts as general guidelines rather than definitive results when developing marketing strategies.
Of the 98 movies tested, the HSX was best at predicting the opening weekend success of fantasy movies (MAPE of 11.7%) and worst at predicting animation movies (MAPE of 33%). In relative terms, I find that predictions of opening weekend revenues deviate less from actual opening weekend revenues for high grossing movies than low grossing movies.
Regression analysis indicates a strong relationship between the risk and return of individual MovieStocks. The results show that for every additional 1% of monthly return, a MovieStock is approximately 6% more volatile. Going one step further, I sort the movies by genre and total revenue to see if any discernible differences in risk and return could be found. In terms of genre, the analysis finds that adventure and thriller movies have slightly higher risk-adjusted returns than other genres. High-grossing movies also have higher risk-adjusted returns than low grossing movies. These characteristics allow us to better interpret HSX predictions and utilize them in forecasting demand and building better MovieStock portfolios.
This analysis also presents some potential areas for future research. Obvious extensions include expanding the 98-movie sample size and increasing the time window past 18 months. Although this paper is limited to predictions of opening-weekend revenues, analysis of virtual market’s ability to forecast post-release demand could provide useful applications in the areas of Internet, DVD, and international sales.
Another opportunity is broadening the study to gauge the affects of other variables on HSX prediction accuracy. For example, is HSX forecast accuracy affected by different movie studios, the date of a film’s release, or the inclusion of different stars? Similarly, it would be interesting to gauge how competition from movies released at similar times affects HSX predictions. Additionally, accessing HSX participant demographics would allow for a better understanding of how the interests of users affects their trading behavior. Another logical extension is examining the affects of different variables on prediction accuracy within other virtual markets such as Intrade and the Iowa Electronics Market.
Attempts to analyze MovieStocks’ correlation to the stock prices of movie studios on traditional exchanges proved challenging because of the scale of modern media conglomerates. As such, the author finds it unlikely that one movie drastically impacts the share price of companies as large as Sony or News Corporation. Gaining access to high-frequency trading data may narrow the time window enough to provide opportunities for an event study of how unexpected hits or flops affect studio valuation.
Appendix
[Figure: Table 10: The Big Six Studios and their Subdivisions]
Caption: Table 10: The Big Six Studios and their Subdivisions (Source: Wikipedia) Figure text:
Conglomerate Parent division Major studio subsidiary Arthouse/"indie" distribution subsidiaries Other divisions and brands Viacom Paramount Motion Pictures Group Paramount Pictures Paramount Vantage Insurge Pictures, Nickelodeon Movies, MTV Films Time Warner Warner Bros. Entertainment Warner Bros. Pictures Warner Independent Pictures (defunct) New Line Cinema, HBO Films, Castle Rock Entertainment, Turner Entertainment, Warner Premiere, Warner Bros. Animation, DC Entertainment Sony Sony Pictures Entertainment Columbia Pictures Sony Pictures Classics ScreenGems, TriStar Pictures, Sony Pictures Animation, Destination Films, Triumph Films, Stage 6 Films, Affirm Films The Walt Disney Company The Walt Disney Studios Walt Disney Pictures Touchstone Pictures, Pixar, Walt Disney Animation Studios, Marvel Studios, Disneynature, Lucasfilm Comcast/General Electric NBCUniversal Universal Pictures Focus Features Universal Animation Studios, Illumination Entertainment, Working Title Films News Corporation Fox Entertainment Group 20th Century Fox Fox Searchlight Pictures 20th Century Fox Animation, Fox Faith, Blue Sky Studios, New Regency Productions (20% equity), Fox Animation Studios
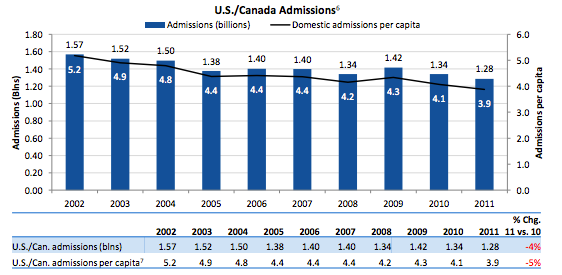
Caption: Figure 7: U.S./Canada Box Office Admissions 2002-2011 (Source: MPAA) Figure text: U.S./Canada Admissions^6 Admissions (billions) — Domestic admissions per capita. Admissions (blns). Admissions per capita. 2002 2003 2004 2005 2006 2007 2008 2009 2010 2011. 1.57 1.52 1.50 1.38 1.40 1.40 1.34 1.42 1.34 1.28. 5.2 4.9 4.8 4.4 4.4 4.4 4.2 4.3 4.1 3.9. % Chg. 2011 11 vs. 10. U.S./Can. admissions (blns) 1.57 1.52 1.50 1.38 1.40 1.40 1.34 1.42 1.34 1.28 -4%. U.S./Can. admissions per capita^7 5.2 4.9 4.8 4.4 4.4 4.4 4.2 4.3 4.1 3.9 -5%.
| Movie | Gross | Release Date | Studio |
|---|---|---|---|
| Skyfall | $299,349,015.00 | 11/9/12 | Sony |
| Hotel Transylvania | $146,638,115.00 | 9/28/12 | Sony |
| Men In Black 3 | $179,020,854.00 | 5/25/12 | Sony |
| Moneyball | $75,605,492.00 | 9/23/11 | Sony |
| The Amazing Spider-man | $262,030,663.00 | 7/3/12 | Sony |
| The Girl with the Dragon Tattoo | $102,515,793.00 | 12/21/11 | Sony |
| The Smurfs | $142,614,158.00 | 7/29/11 | Sony |
| The Vow | $125,014,030.00 | 2/10/12 | Sony |
| Think Like a Man | $91,547,205.00 | 4/20/12 | Sony |
| 21 Jump Street | $138,447,667.00 | 3/16/12 | Sony |
| The Dark Knight Rises | $448,130,642.00 | 7/20/12 | Warner Bros |
| The Hobbit: An Unexpected Journey | $278,212,618.00 | 12/14/12 | Warner Bros |
| Sherlock Holmes: A Game of Shadows | $186,830,669.00 | 12/16/11 | Warner Bros |
| Magic Mike | $113,709,992.00 | 6/29/12 | Warner Bros |
| Argo | $111,660,243.00 | 10/12/12 | Warner Bros |
| The Campaign | $86,897,182.00 | 8/10/12 | Warner Bros |
| Crazy, Stupid, Love | $84,323,970.00 | 7/29/11 | Warner Bros |
| Wrath of the Titans | $83,640,426.00 | 3/30/12 | Warner Bros |
| Dark Shadows | $79,711,678.00 | 5/11/12 | Warner Bros |
| Contagion | $75,638,743.00 | 9/9/11 | Warner Bros |
| Madagascar 3: Europe's Most Wanted | $216,366,733.00 | 6/8/12 | Paramount |
| Mission: Impossible-Ghost Protocol | $209,364,921.00 | 12/21/11 | Paramount |
| Captain America: The First Avenger | $176,636,816.00 | 7/22/11 | Paramount |
| Puss in Boots | $149,234,747.00 | 10/28/11 | Paramount |
| Paranormal Activity 3 | $104,007,828.00 | 10/21/11 | Paramount |
| Rise of the Guardians | $98,750,400.00 | 11/21/12 | Paramount |
| Flight | $92,741,718.00 | 11/2/12 | Paramount |
| The Adventures of Tintin | $77,564,037.00 | 12/21/11 | Paramount |
| Hugo | $73,820,094.00 | 11/23/11 | Paramount |
| Jack Reacher | $72,628,585.00 | 12/21/12 | Paramount |
| The Avengers | $623,279,547.00 | 5/4/12 | Walt Disney |
| Brave | $237,282,182.00 | 6/22/12 | Walt Disney |
| Wreck-It Ralph | $179,379,615.00 | 11/2/12 | Walt Disney |
| Lincoln | $152,600,253.00 | 11/16/12 | Walt Disney |
| The Lion King 3D | $94,240,635.00 | 9/16/11 | Walt Disney |
| The Muppets | $88,625,922.00 | 11/23/11 | Walt Disney |
| War Horse | $79,883,359.00 | 12/25/11 | Walt Disney |
| John Carter | $73,058,679.00 | 3/9/12 | Walt Disney |
| The Odd Life of Timothy Green | $51,853,450.00 | 8/15/12 | Walt Disney |
| Beauty and the Beast 3D | $47,611,331.00 | 1/13/12 | Walt Disney |
| Ted | $218,628,680.00 | 6/29/12 | Universal |
| Dr. Seuss' the Lorax | $213,949,505.00 | 3/2/12 | Universal |
| Snow White & The Huntsman | $155,111,815.00 | 6/1/12 | Universal |
| Safe House | $126,149,655.00 | 2/10/12 | Universal |
| Les Miserables | $118,723,185.00 | 12/25/12 | Universal |
| The Bourne Legacy | $113,165,635.00 | 8/10/12 | Universal |
| Cowboys & Aliens | $100,215,116.00 | 7/29/11 | Universal |
| Tower Heist | $78,009,155.00 | 11/4/11 | Universal |
| Contraband | $66,489,425.00 | 1/13/12 | Universal |
| Battleship | $65,173,160.00 | 5/18/12 | Universal |
| Rise of the Planet of the Apes | $176,740,650.00 | 8/5/11 | 20th Century Fox |
| Ice Age: Continental Drift | $161,239,971.00 | 7/13/12 | 20th Century Fox |
| Taken 2 | $139,499,963.00 | 10/5/12 | 20th Century Fox |
| Alvin and the Chipmunks: Chipwrecked | $133,103,929.00 | 12/16/11 | 20th Century Fox |
| Prometheus | $126,464,904.00 | 6/8/12 | 20th Century Fox |
| Life of Pi | $94,800,726.00 | 11/21/12 | 20th Century Fox |
| We Bought a Zoo | $75,621,915.00 | 12/23/11 | 20th Century Fox |
| Chronicle | $64,572,496.00 | 2/3/12 | 20th Century Fox |
| Parental Guidance | $60,639,142.00 | 12/25/12 | 20th Century Fox |
| This Means War | $54,758,461.00 | 2/17/12 | 20th Century Fox |
| The Hunger Games | $407,999,255.00 | 3/23/12 | Lionsgate |
[Figure: Table listing movie titles, box office earnings, release dates, and distributors]
Caption: Table 11: Master List of 98 Movies Included in Study
| Movie Title | Box Office | Release Date | Distributor |
|---|---|---|---|
| The Expendables 2 | $85,017,401.00 | 8/17/12 | Lionsgate |
| Madea's Witness Protection | $65,623,128.00 | 6/29/12 | Lionsgate |
| The Possession | $49,122,319.00 | 8/31/12 | Lionsgate |
| The Cabin in the Woods | $42,043,633.00 | 4/13/12 | Lionsgate |
| What to Expect When You're Expecting | $41,102,171.00 | 5/18/12 | Lionsgate |
| Good Deeds | $35,010,192.00 | 2/24/12 | Lionsgate |
| Texas Chainsaw 3D | $30,880,985.00 | 1/4/13 | Lionsgate |
| Abduction | $28,064,226.00 | 9/23/11 | Lionsgate |
| One for the Money | $26,404,753.00 | 1/27/12 | Lionsgate |
| The Twilight Saga: Breaking Dawn Part 2 | $290,177,709.00 | 11/16/12 | Summit Entertainment |
| The Twilight Saga: Breaking Dawn Part 1 | $281,275,991.00 | 11/18/11 | Summit Entertainment |
| Sinister | $48,056,940.00 | 10/12/12 | Summit Entertainment |
| Step Up: Revolution | $35,057,332.00 | 7/27/12 | Summit Entertainment |
| 50/50 | $35,009,118.00 | 9/30/11 | Summit Entertainment |
| Alex Cross | $25,863,915.00 | 10/19/12 | Summit Entertainment |
| The Darkest Hour | $21,426,805.00 | 12/25/11 | Summit Entertainment |
| The Three Musketeers | $20,362,913.00 | 10/21/11 | Summit Entertainment |
| Man on a Ledge | $18,600,911.00 | 1/27/12 | Summit Entertainment |
| The Perks of Being a Wallflower | $17,581,481.00 | 10/12/12 | Summit Entertainment |
| Django Unchained | $125,374,607.00 | 12/25/12 | Weinstein Co. |
| The Artist | $44,667,095.00 | 1/20/12 | Weinstein Co. |
| Silver Linings Playbook | $41,324,232.00 | 12/25/12 | Weinstein Co. |
| Lawless | $37,397,291.00 | 8/29/12 | Weinstein Co. |
| The Iron Lady | $29,959,436.00 | 1/13/12 | Weinstein Co. |
| Our Idiot Brother | $24,814,830.00 | 8/26/11 | Weinstein Co. |
| Apollo 18 | $17,686,929.00 | 9/2/11 | Weinstein Co. |
| The Master | $16,008,867.00 | 9/21/12 | Weinstein Co. |
| Killing Them Softly | $14,938,570.00 | 11/30/12 | Weinstein Co. |
| My Week with Marilyn | $14,597,405.00 | 11/23/11 | Weinstein Co. |
| Immortals | $83,503,161.00 | 11/11/11 | Relativity |
| Act of Valor | $70,011,073.00 | 2/24/12 | Relativity |
| Mirror Mirror | $64,933,670.00 | 3/30/12 | Relativity |
| House at the End of the Street | $31,607,598.00 | 9/21/12 | Relativity |
| Haywire | $18,934,858.00 | 1/20/12 | Relativity |
| Shark Night 3D | $18,872,522.00 | 9/2/11 | Relativity |
| The Raven | $16,005,978.00 | 4/27/12 | Relativity |
| Machine Gun Preacher | $537,580.00 | 9/23/11 | Relativity |
Regression of HSX Expectation of Opening Weekend 1 Day Before Release: SUMMARY OUTPUT Independent (X): Actual Gross, Dependent (Y): HSX Expectation
| Regression Statistics | |
|---|---|
| Multiple R | 0.964515685 |
| R Square | 0.930290507 |
| Adjusted R Square | 0.929564367 |
| Standard Error | 8.689217982 |
| Observations | 98 |
| ANOVA | |||||
|---|---|---|---|---|---|
| df | SS | MS | F | Significance F | |
| Regression | 1 | 96729.5763 | 96729.5763 | 1281.143864 | 2.52956E-57 |
| Residual | 96 | 7248.240877 | 75.50250913 | ||
| Total | 97 | 103977.8172 |
| Coefficients | Standard Error | t Stat | P-value | Lower 95% | Upper 95% | Lower 95.0% | Upper 95.0% | |
|---|---|---|---|---|---|---|---|---|
| Intercept | 2.068196888 | 1.234785717 | 1.674943968 | 0.097199898 | -0.382833387 | 4.519227164 | -0.382833387 | 4.519227164 |
| Actual Opening | 0.875371832 | 0.024456461 | 35.79307006 | 2.52956E-57 | 0.826826141 | 0.923917524 | 0.826826141 | 0.923917524 |
Table 12: Regression of HSX Expectations of Opening Weekend 1 Day Before Release
Regression of HSX Expectations of Opening Weekend 80 Days Before Release: SUMMARY OUTPUT Independent (X): Actual Gross, Dependent (Y): HSX Expectation
| Regression Statistics | |
|---|---|
| Multiple R | 0.847513323 |
| R Square | 0.718278832 |
| Adjusted R Square | 0.715344237 |
| Standard Error | 15.16055734 |
| Observations | 98 |
| ANOVA | |||||
|---|---|---|---|---|---|
| df | SS | MS | F | Significance F | |
| Regression | 1 | 56256.81694 | 56256.81694 | 244.762466 | 3.72512E-28 |
| Residual | 96 | 22064.87989 | 229.8424988 | ||
| Total | 97 | 78321.69682 |
| Coefficients | Standard Error | t Stat | P-value | Lower 95% | Upper 95% | Lower 95.0% | Upper 95.0% | |
|---|---|---|---|---|---|---|---|---|
| Intercept | 9.432282755 | 2.154398669 | 4.378151031 | 3.0491E-05 | 5.155835196 | 13.70873031 | 5.155835196 | 13.70873031 |
| Actual Opening | 0.667575674 | 0.042670535 | 15.64488628 | 3.72512E-28 | 0.582875331 | 0.752276018 | 0.582875331 | 0.752276018 |
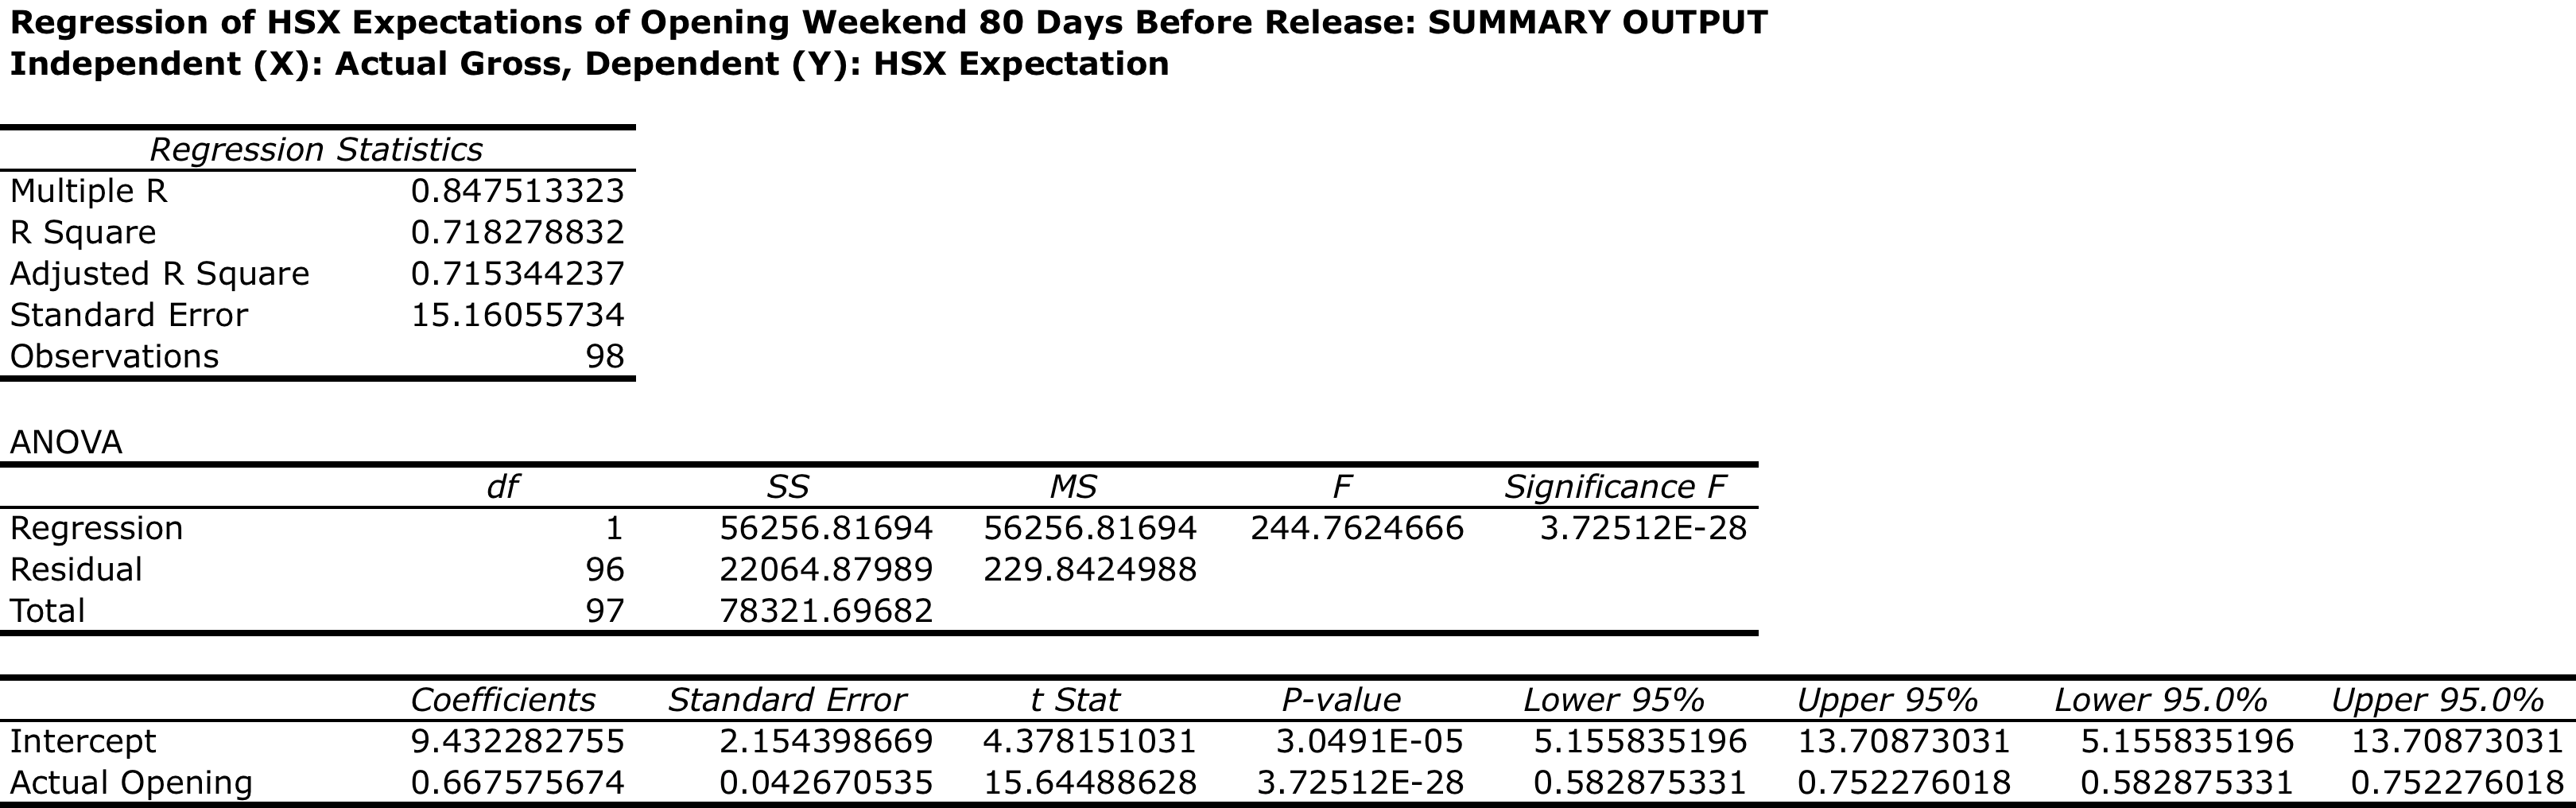
Caption: Table 13: Regression of HSX Expectations of Opening Weekend 80 Days Before Release Figure text: (Table content as transcribed above)
41
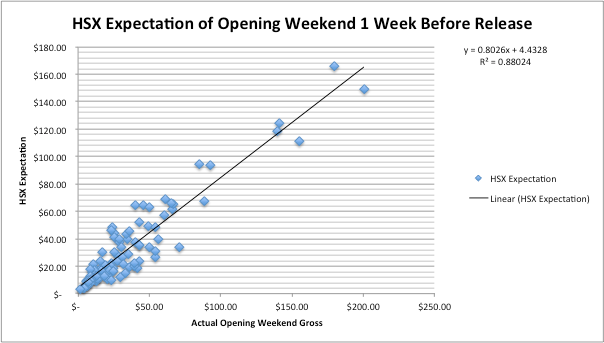
Caption: Figure 8: HSX Expectation of Opening Weekend Revenue 1 Week Before Release Figure text: HSX Expectation of Opening Weekend 1 Week Before Release. HSX Expectation. Actual Opening Weekend Gross. y = 0.8026x + 4.4328 R² = 0.88024. HSX Expectation. Linear (HSX Expectation).

Caption: Figure 9: HSX Expectation of Opening Weekend Revenue 2 Weeks Before Release Figure text: HSX Expectation of Opening Weekend 2 Weeks Before Release. HSX Expectation. Actual Opening Weekend Gross. y = 0.759x + 6.2052 R² = 0.83759. HSX Expectation. Linear (HSX Expectation).
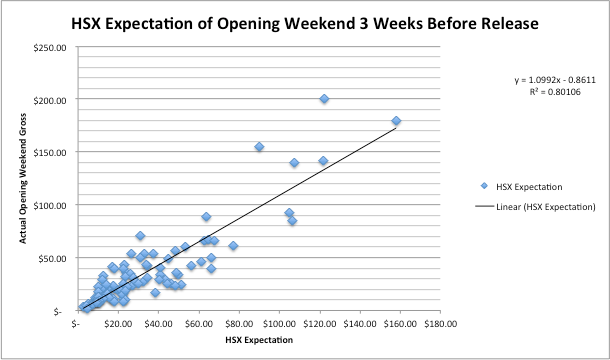
Caption: Figure 10: HSX Expectation of Opening Weekend Revenue 3 Weeks Before Release Figure text: HSX Expectation of Opening Weekend 3 Weeks Before Release Actual Opening Weekend Gross HSX Expectation y = 1.0992x - 0.8611 R² = 0.80106 HSX Expectation Linear (HSX Expectation) $- $20.00 $40.00 $60.00 $80.00 $100.00 $120.00 $140.00 $160.00 $180.00 $- $50.00 $100.00 $150.00 $200.00 $250.00

Caption: Figure 11: HSX Expectation of Opening Weekend Revenue 50 Days Before Release Figure text: HSX Expectation of Opening Weekend 50 Days Before Release HSX Expectation Actual Opening Weekend Gross y = 0.6986x + 8.3017 R² = 0.74482 HSX Expectation Linear (HSX Expectation) $- $50.00 $100.00 $150.00 $200.00 $250.00 $- $20.00 $40.00 $60.00 $80.00 $100.00 $120.00 $140.00 $160.00 $180.00
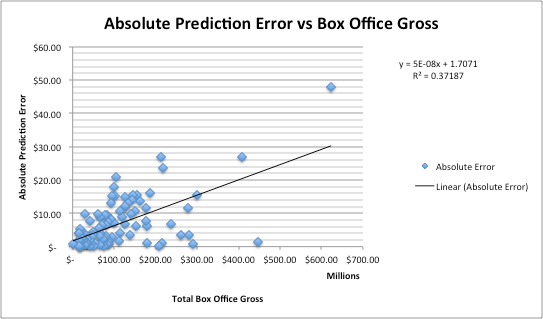
Caption: Figure 12: Absolute Prediction Error vs. Total Box Office Gross Figure text: Absolute Prediction Error vs. Box Office Gross $60.00 $50.00 $40.00 $30.00 $20.00 $10.00 $- $- $100.00 $200.00 $300.00 $400.00 $500.00 $600.00 $700.00 Millions Total Box Office Gross y = 5E-08x + 1.7071 R² = 0.37187 Absolute Error Linear (Absolute Error)
| Aggregated HSX MovieStock Monthly Returns, Summary Statistics | |||
|---|---|---|---|
| Count | 86 | Skewness | 5.6424 |
| Mean | 0.05091 | Skewness Standard Error | 0.25664 |
| Mean LCL | 0.02747 | Kurtosis | 43.4398 |
| Mean UCL | 0.07435 | Kurtosis Standard Error | 0.49591 |
| Variance | 0.0084 | Alternative Skewness (Fisher's) | 5.74306 |
| Standard Deviation | 0.09168 | Alternative Kurtosis (Fisher's) | 42.96648 |
| Mean Standard Error | 0.00989 | Coefficient of Variation | 1.8009 |
| Minimum | -0.1085 | Mean Deviation | 0.04549 |
| Maximum | 0.7614 | Second Moment | 0.00831 |
| Range | 0.8699 | Third Moment | 0.00427 |
| Sum | 4.378 | Fourth Moment | 0.003 |
| Sum Standard Error | 0.85019 | Median | 0.02725 |
| Total Sum Squares | 0.93729 | Median Error | 0.00134 |
| Adjusted Sum Squares | 0.71442 | Percentile 25% (Q1) | 0.01555 |
| Geometric Mean | 0.03616 | Percentile 75% (Q2) | 0.06155 |
| Harmonic Mean | 0.03887 | IQR | 0.046 |
| Mode | #N/A | MAD | 0.0163 |
Table 14: HSX MovieStock Return Summary Statistics
| Aggregated HSX MovieStock Monthly Standard Deviations, Summary Statistics | |||
|---|---|---|---|
| Count | 86 | Skewness | 5.44442 |
| Mean | 0.30877 | Skewness Standard Error | 0.25664 |
| Mean LCL | 0.15766 | Kurtosis | 36.53489 |
| Mean UCL | 0.45989 | Kurtosis Standard Error | 0.49591 |
| Variance | 0.34934 | Alternative Skewness (Fisher's) | 5.54155 |
| Standard Deviation | 0.59105 | Alternative Kurtosis (Fisher's) | 35.64264 |
| Mean Standard Error | 0.06373 | Coefficient of Variation | 1.9142 |
| Minimum | 0.0584 | Mean Deviation | 0.27079 |
| Maximum | 4.6136 | Second Moment | 0.34528 |
| Range | 4.5552 | Third Moment | 1.10462 |
| Sum | 26.5545 | Fourth Moment | 4.35566 |
| Sum Standard Error | 5.4812 | Median | 0.16005 |
| Total Sum Squares | 37.89351 | Median Error | 0.00861 |
| Adjusted Sum Squares | 29.69419 | Percentile 25% (Q1) | 0.10875 |
| Geometric Mean | 0.18336 | Percentile 75% (Q2) | 0.22545 |
| Harmonic Mean | 0.14657 | IQR | 0.1167 |
| Mode | 0.0909 | MAD | 0.0524 |
Table 15: HSX MovieStock Standard Deviation Summary Statistics
| Movie | Gross | Avg. HSX Return | Avg. HSX Std. | Return/Std. Ratio |
|---|---|---|---|---|
| The Hunger Games | $407,999,255.00 | 13.28% | 13.87% | 0.957 |
| Argo | $111,660,243.00 | 7.69% | 8.65% | 0.890 |
| Snow White & The Huntsman | $155,111,815.00 | 7.45% | 12.68% | 0.587 |
| Safe House | $126,149,655.00 | 8.97% | 19.40% | 0.462 |
| Dr. Seuss' the Lorax | $213,949,505.00 | 3.61% | 8.32% | 0.434 |
| Sinister | $48,056,940.00 | 6.81% | 15.69% | 0.434 |
| Rise of the Planet of the Apes | $176,740,650.00 | 13.23% | 31.10% | 0.425 |
| Men In Black 3 | $179,020,854.00 | 5.50% | 14.00% | 0.393 |
| Contraband | $66,489,425.00 | 6.85% | 18.06% | 0.380 |
| Brave | $237,282,182.00 | 2.07% | 5.84% | 0.354 |
| The Expendables 2 | $85,017,401.00 | 3.69% | 10.69% | 0.345 |
| Crazy, Stupid, Love | $84,323,970.00 | 2.54% | 7.65% | 0.332 |
| Ted | $218,628,680.00 | 6.17% | 19.07% | 0.324 |
| Django Unchained | $125,374,607.00 | 3.47% | 10.91% | 0.318 |
| The Vow | $125,014,030.00 | 9.13% | 29.48% | 0.310 |
| Contagion | $75,638,743.00 | 3.29% | 11.16% | 0.295 |
| The Campaign | $86,897,182.00 | 3.58% | 12.18% | 0.294 |
| The Twilight Saga: Breaking Dawn Part 1 | $281,275,991.00 | 2.62% | 8.93% | 0.293 |
| Flight | $92,741,718.00 | 6.04% | 21.85% | 0.276 |
| 21 Jump Street | $138,447,667.00 | 4.35% | 15.96% | 0.273 |
| The Twilight Saga: Breaking Dawn Part 2 | $290,177,709.00 | 1.63% | 6.15% | 0.266 |
| We Bought a Zoo | $75,621,915.00 | 2.31% | 8.91% | 0.259 |
| The Dark Knight Rises | $448,130,642.00 | 1.79% | 7.50% | 0.239 |
| Moneyball | $75,605,492.00 | 2.06% | 8.61% | 0.239 |
| Battleship | $65,173,160.00 | 3.61% | 15.34% | 0.235 |
| Silver Linings Playbook | $41,324,232.00 | 3.91% | 16.70% | 0.234 |
| Madagascar 3: Europe's Most Wanted | $216,366,733.00 | 1.85% | 7.93% | 0.233 |
| The Avengers | $623,279,547.00 | 5.37% | 23.38% | 0.230 |
| Step Up: Revolution | $35,057,332.00 | 3.70% | 16.56% | 0.224 |
| Jack Reacher | $72,628,585.00 | 2.02% | 9.09% | 0.222 |
| Les Miserables | $118,723,185.00 | 2.02% | 9.09% | 0.222 |
| Skyfall | $299,349,015.00 | 2.97% | 13.72% | 0.216 |
| Wreck-It Ralph | $179,379,615.00 | 2.82% | 13.30% | 0.212 |
| Taken 2 | $139,499,963.00 | 3.00% | 14.21% | 0.211 |
| Parental Guidance | $60,639,142.00 | 6.14% | 29.27% | 0.210 |
| The Muppets | $88,625,922.00 | 5.17% | 25.15% | 0.206 |
| The Possession | $49,122,319.00 | 3.50% | 18.22% | 0.192 |
| The Smurfs | $142,614,158.00 | 4.40% | 23.24% | 0.190 |
| Dark Shadows | $79,711,678.00 | 3.00% | 16.05% | 0.187 |
| The Odd Life of Timothy Green | $51,853,450.00 | 7.28% | 39.69% | 0.183 |
| Lawless | $37,397,291.00 | 6.82% | 38.37% | 0.178 |
| House at the End of the Street | $31,607,598.00 | 13.36% | 75.38% | 0.177 |
| Wrath of the Titans | $83,640,426.00 | 1.79% | 10.59% | 0.169 |
| Prometheus | $126,464,904.00 | 3.31% | 19.65% | 0.168 |
| My Week with Marilyn | $14,597,405.00 | 14.84% | 89.01% | 0.167 |
| Captain America: The First Avenger | $176,636,816.00 | 8.78% | 52.85% | 0.166 |
| Mission: Impossible- Ghost Protocol | $209,364,921.00 | 6.67% | 40.38% | 0.165 |
| Beauty and the Beast 3D | $47,611,331.00 | 76.14% | 461.36% | 0.165 |
| Immortals | $83,503,161.00 | 2.24% | 13.63% | 0.164 |
| John Carter | $73,058,679.00 | 15.91% | 101.55% | 0.157 |
| Hotel Transylvania | $146,638,115.00 | 2.48% | 16.15% | 0.153 |
| The Adventures of Tintin | $77,564,037.00 | 14.70% | 96.51% | 0.152 |
| Sherlock Holmes: A Game of Shadows | $186,830,669.00 | 1.42% | 9.60% | 0.148 |
| 50/50 | $35,009,118.00 | 2.63% | 18.57% | 0.142 |
| The Hobbit: An Unexpected Journey | $278,212,618.00 | 1.60% | 12.37% | 0.129 |
| Puss in Boots | $149,234,747.00 | 2.33% | 18.69% | 0.125 |
| Mirror Mirror | $64,933,670.00 | 2.01% | 16.26% | 0.123 |
| Hugo | $73,820,094.00 | 10.74% | 87.27% | 0.123 |
| Cowboys & Aliens | $100,215,116.00 | 20.81% | 173.59% | 0.120 |
| The Cabin in the Woods | $42,043,633.00 | 1.46% | 12.52% | 0.117 |
| Tower Heist | $78,009,155.00 | 2.03% | 17.72% | 0.114 |
| Life of Pi | $94,800,726.00 | 5.69% | 52.40% | 0.109 |
| This Means War | $54,758,461.00 | 0.99% | 9.20% | 0.108 |
| The Amazing Spider-man | $262,030,663.00 | 1.21% | 11.91% | 0.101 |
| Lincoln | $152,600,253.00 | 23.52% | 257.22% | 0.091 |
| Killing Them Softly | $14,938,570.00 | 1.55% | 17.34% | 0.089 |
| Man on a Ledge | $18,600,911.00 | 1.77% | 20.04% | 0.089 |
| The Bourne Legacy | $113,165,635.00 | 2.24% | 25.23% | 0.089 |
| Rise of the Guardians | $98,750,400.00 | 0.85% | 9.89% | 0.086 |
| Haywire | $18,934,858.00 | 1.43% | 16.82% | 0.085 |
| The Girl with the Dragon Tattoo | $102,515,793.00 | 1.56% | 19.28% | 0.081 |
| One for the Money | $26,404,753.00 | 1.09% | 14.71% | 0.074 |
| The Iron Lady | $29,959,436.00 | 0.76% | 10.31% | 0.073 |
| Alex Cross | $25,863,915.00 | 1.46% | 19.84% | 0.073 |
| Our Idiot Brother | $24,814,830.00 | 1.18% | 16.95% | 0.070 |
| The Three Musketeers | $20,362,913.00 | 0.98% | 17.45% | 0.056 |
| The Darkest Hour | $21,426,805.00 | 0.97% | 19.76% | 0.049 |
| Abduction | $28,064,226.00 | 0.46% | 13.31% | 0.035 |
| The Raven | $16,005,978.00 | 0.40% | 12.10% | 0.033 |
| Texas Chainsaw 3D | $30,880,985.00 | 0.35% | 10.84% | 0.032 |
| Ice Age: Continental Drift | $161,239,971.00 | 0.24% | 7.64% | 0.031 |
| The Master | $16,008,867.00 | 0.15% | 14.34% | 0.011 |
| War Horse | $79,883,359.00 | -0.05% | 6.89% | -0.007 |
| The Perks of Being a Wallflower | $17,581,481.00 | -0.21% | 15.18% | -0.014 |
| Alvin and the Chipmunks: Chipwrecked | $133,103,929.00 | -0.90% | 9.57% | -0.094 |
| Machine Gun Preacher | $537,580.00 | -10.85% | 27.61% | -0.393 |
| Average | $114,748,059.41 | 5.09% | 30.88% | 0.196 |
Table 16: 86 Movies Sorted by Return/Std. Ratio
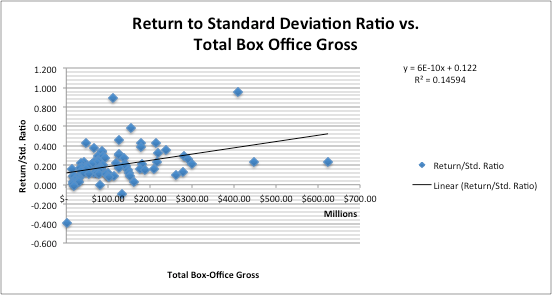
Caption: Figure 13: Return/Std. Ratio vs. Total Box Office Gross Figure text: Return to Standard Deviation Ratio vs. Total Box Office Gross. y = 6E-10x + 0.122. R² = 0.14594. Return/Std. Ratio. Linear (Return/Std. Ratio). $100.00 $200.00 $300.00 $400.00 $500.00 $600.00 $700.00 Millions. Total Box-Office Gross.
References
Asur, Sitaram , and Bernardo A. Huberman. "Predicting the Future With Social Media." (2010): n. pag. Arxiv.org. Web. 8 Oct. 2012. http://arxiv.org/pdf/1003.5699v1.pdf.
Berg, Joyce E., and Thomas A. Rietz. "Prediction Markets as Decision Support Systems." Information Systems Frontiers 5.1 (2003): 79-93. Kluwer Academic Publishers. Web. 8 Oct. 2012. <http://www.google.com/url?sa=t&rct=j&q=&esrc=s&source=web&cd=2&ved=0CCYQFjAB&url=http%3A%2F%2Fciteseerx.ist.psu.edu%2Fviewdoc.. >.
Brealey, Richard A., Stewart C. Myers, and Franklin Allen. Principles of Corporate Finance. New York, NY: McGraw-Hill/Irwin, 2011. Print.
Corcoran, Andrea. "CFTC No-Action Letter." Letter to Professor Neumann. 5 Feb. 1992.CFTC.gov. U.S. Commodity Futures Trading Commission, n.d. Web. 11 Feb. 2013. http://www.cftc.gov/ucm/groups/public/@lrlettergeneral/documents/letter/92-04a.pdf.
Chen, Kay-Yut, and Charles R. Plott. Information Aggregation Mechanisms: Concept, Design and Implementation for a Sales Forecasting Problem. Diss. California Institute of Technology, 2002. N.p.: n.p., n.d. Hewlett Packard Laboratories. Web. 21 Feb. 2013. http://www.hss.caltech.edu/SSPapers/wp1131.pdf.
Elberse, Anita. "The Power Of Stars: Do Star Actors Drive The Success Of Movies?." Journal Of Marketing 71.4 (2007): 102-120. Communication & Mass
Media Complete. Web. 14 Feb. 2013.
Elberse, A., and B. Anand. "The Effectiveness of Pre-release Advertising for Motion Pictures: An Empirical Investigation Using a Simulated Market." Information Economics and Policy 19.3-4 (2007): 319-43. Print.
Foutz, Natasha, and Wolfgang Jank. "The Wisdom of Crowds: Pre-release Forecasting via Functional Shape Analysis of the Online Virtual Stock Market." Umd.edu. University of Maryland, 2007. Web. 21 Feb. 2013. http://www.rhsmith.umd.edu/faculty/wjank/HSX-prediction-Foutz%26Jank.pdf.
Joshi, Amit M., and Dominique M. Hansenns. "Movie Advertising and the Stock Market Valuation of Studios: A Case of “Great Expectations”?" Thesis. University of Central Florida, UCLA, 2008. Web. 20 Jan. 2013. http://www.anderson.ucla.edu/faculty/dominique.hanssens/content/movie_paper_final_011808.pdf.
Hollywood Stock Exchange. Traders Correctly Pick 7 out of 8 Top Category Oscar Winners Continuing Its Stellar Record. HSX. Hollywood Stock Exchange, 2007. Web. 21 Feb. 2013. http://www.hsx.com/about/pr_oscar_2007.pdf.
"Motion Picture Production & Distribution." Hoovers. Dun & Bradstreet, n.d. Web. 27 Nov. 2012. <http://subscriber.hoovers.com/H/industry360/overview.html?industry Id=1455>.
Pennock, David M., Steve Lawrence, Finn A. Nielsen, and C. L. Giles. "Extracting Collective Probabilistic Forecasts from Web Games." E-business Research Center (2001): n. pag. ACM Digital Library. Web. 8 Oct. 2012.
<http://delivery.acm.org/10.1145/510000/502537/p174-pennock.pdf?... >.
Prag, Jay, and James Casavant. "An Empirical Study of the Determinants of Revenues and Marketing Expenditures in the Motion Picture Industry." Journal of Culture Economics 18 (1994): 217-35. Springer. Web. 20 Jan. 2013.
Servan-Schreiber, Emile, Justin Wolfers, David M. Pennock, and Brian Galebach. "Prediction Markets: Does Money Matter?" Electronic Markets 14.3 (2004): 243-51. Print.
Theatrical Market Statistics 2007. Rep. Motion Picture Association of America, Inc., 2011. Web. 27 Nov. 2012. http://www.mpaa.org/Resources/5bec4ac9-a95e-443b-987b-bff6fb5455a9.pdf.
Theatrical Market Statistics 2011. Rep. Motion Picture Association of America, Inc., 2011. Web. 27 Nov. 2012. http://www.mpaa.org/Resources/5bec4ac9-a95e-443b-987b-bff6fb5455a9.pdf.
Wolfers, Justin, and Eric Zitzewitz. "Prediction Markets." Stanford Institute For Economic Policy Research (2004): n. pag. Web. 8 Oct. 2012. http://www-siepr.stanford.edu/repec/sip/03-025.pdf.
ACADEMIC VITA
Benjamin A Olsho 1505 Wynnemoor Way Fort Washington, PA 19034 benjaminolsho@gmail.com
Education
Bachelor of Science Degree in Finance, 2013, Penn State University, University Park, PA
Minor: Energy, Business, and Finance
Related Experience
Internship with Shell Exploration and Production Company, Summer 2012
Internship with Global Tower Partners, Summer 2011 and 2010
Internship with Symphony IRI Group, Summer 2009
Association Memberships/Activities
Phi Gamma Nu Professional Business Fraternity, 2009-2013
Penn State Investment Association, 2009-2012
Sapphire Leadership Program, 2009-2013
Wall Street Boot Camp, Spring 2011
Honors/Awards
President’s Freshman Award, Penn State University
Winner, 3rd Place, FBLA National Conference – Management Decision Competition
Notes
Footnotes
-
The author would like to thank Penn State’s Smeal College of Business, its Finance Department, and the College of Earth and Mineral Sciences for their support of this research. ↩